

The Skincare Tracker
Refine your China strategy with our skincare tracker. Whether you need quick insights or in-depth historical data, we’ve got you covered with monthly ecommerce data stretching back to September 2020 and covering 17 skincare categories.
Unsubscribe at any time!
What you will find in our tracker
Our skincare tracker covers 17 categories (facial sets, serums, face masks, creams and milks, cleansers, eye care, sun protection, lotions and toners, makeup remover, body care, male facial care, hand car, lip care, body cleansing, T-zone care, essential oils and male body care) with data arching back to September 2020. Each month, the top 500 listings are collated from each category, that’s 8,500 ecommerce data points monthly that go into our interactive data report. Our dashboards are designed to be entirely interactive allowing you to filter results and gain a comprehensive understanding of the market on the ground. Our skincare tracker now also include social media data from Douyin, RED and Weibo which collates skincare-related content and analysis the content by function, formats, features and ingredients. Find out not only what is selling well on ecommerce but also what people are posting about online! Here is what you can expect (for reference, images below only include data from 2020 through to mid-2021):

CATEGORY OVERVIEW
This is your one-stop shop for a broad category understanding: i.e. which categories are dominant, how much is selling overall, how is each category broadly trending, what are the top brands and how domestic sales fair versus foreign sales.
Switch between field parameters (sales revenue or sales units) depending on your needs or filter results by selecting any of the labels or bars on the page.

MARKET MAP
The market map plots the top 25 brands by performance (sales revenue) and premium (weighted average sales price). The premium is weighted against sales orders giving us a better idea of what consumers are actually paying for the brands.
Filter the map by product category or brand origin (on the right) to get a better sense of your competition. You can also filter by date by selecting any data point under ‘Sales Trend’. Hold ‘ctrl’ to apply multiple filters.

ALL BRANDS
Here we take a deeper dive into the skincare brands online and review their performance over the past 12 months, including total revenue, number of listings, average price, weighted average price and average month on month growth. Order the table by any of these fields to see which brands come out on top. Select any brand to see their sales revenue over the past 12 months, as well as a breakdown of their revenue by product category.
Filter the table by origin (domestic or foreign) and/or by product category to see, for example, the top selling foreign brands in the eye care category.
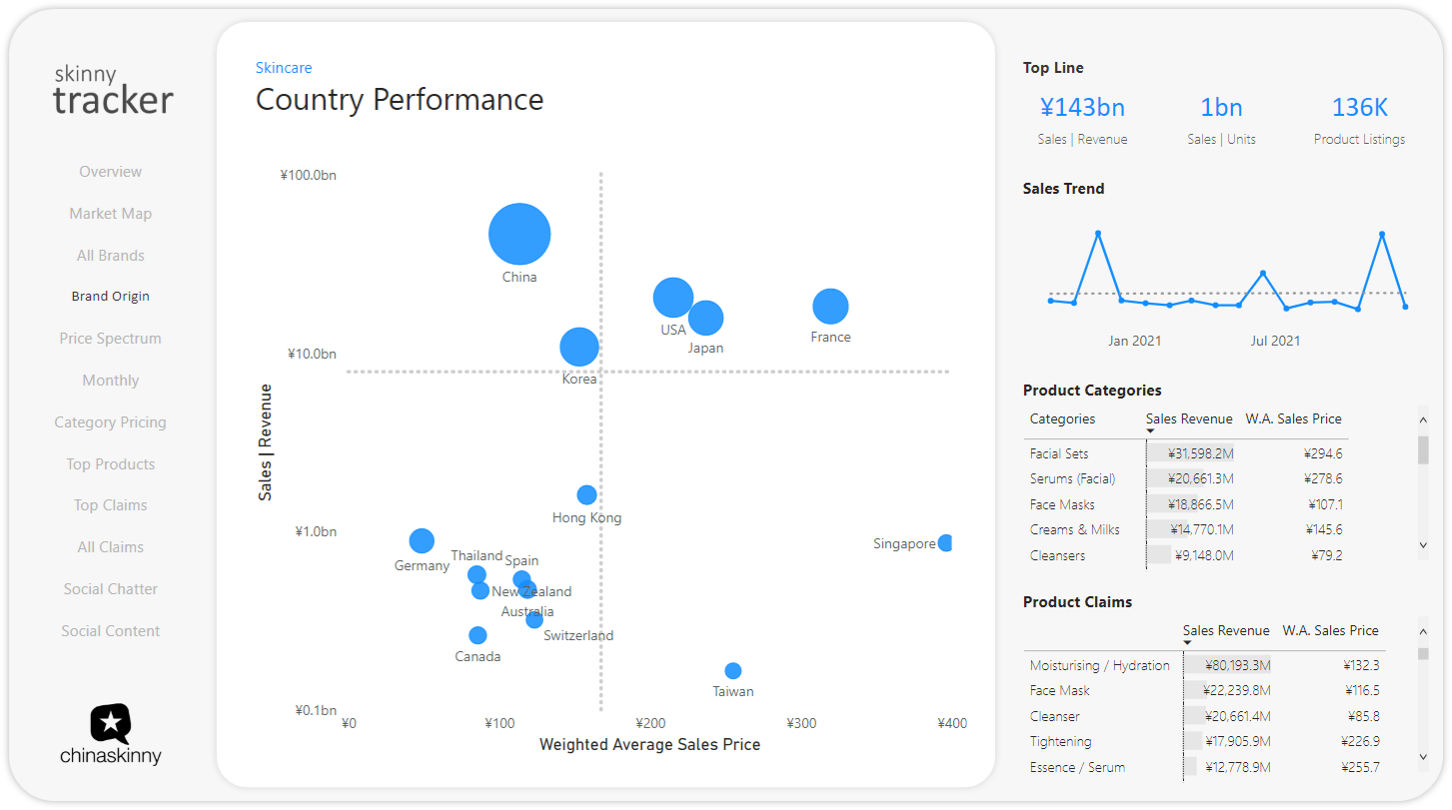
COUNTRY PERFORMANCE
Similar to the market map, country performance compares product origins, giving you an idea of which countries are selling well, which countries are dropping off, which countries demand the highest premiums etc.
Filter by specific product category or even product claim to see which countries are dominating in different spaces and where your brand might find your niche.

PRICE SPECTRUM
In the price spectrum you will find the sales revenue shown as market share and divided up into price bins along a price spectrum from the lowest prices to the higher ones. Here you can select a price bracket to see how saturated it is, what are the market averages, sales averages and weighted averages in terms of price, as well as a break down of the top brands in said bracket.
Filter by category or adjust the price range to better reflect your competition and adjust your place in the market.

MONTHLY BREAKDOWN
In the monthly breakdown you will get a clearer view of sales revenue and a month on month rolling average growth over time. This can be filtered by specific product category and brand origin, while the sales revenue can be switched to unit sold instead, depending on your needs.

CATEGORY PRICING
In category pricing you will get a breakdown of how well each category is priced and discounted. A measure calculated by comparing the market price (what brands put on the market) against the weighted average price (i.e. what people are actually paying) which gives us the category performance, i.e. over-priced or under-priced. The same is done for discounts.
Filter by brand origin and adjust the price range to better reflect your competition or position in the market. This, along with the price spectrum will aid you in adjusting your pricing strategy.

TOP-SELLING PRODUCTS
Here you will find the top-selling products ordered by revenue, alongside brand origin (indicated by the flag), brand, category, listed price and sales price. Filter by specific product category or country of origin to get a better idea of the best selling products in your space.
Open the listing by selecting the brand name which is underlined. This will take you directly to the product page, unless it has already been removed by the brand or store. The top-selling product will always be displayed in the top-right corner and will adjust based on the filters applied.

TOP CLAIMS & ALL CLAIMS
Our last two pages are devoted to product claims which are search from our product listings. Here we get a market map style visual of the top-selling product claims on the market and these can be filtered by product category.
Select a product category to view its sales trend (top right), as well as how it performs in terms of market presence and market share, and this is also presented over time.
All claims follows the same format as the ‘All Brands’ page and is a deeper diver whereby the claims are listed out by revenue, price, presence and growth, with trends represented in the auxiliary pane.

SOCIAL CHATTER
Introducing the new social chatter feature. Two pages of social media data take from some of the biggest social media platforms in China (Douyin - 抖音, Little Red Book - 小红书 and Weibo - 微博). Skincare posts are scrawled and analysed to highlight what kinds of topics and content are being created about the skincare.
Get a breakdown of topics by function, format, features or ingredients including data points such as post count, engagement, engagement rate and sentiment. View a list of all posts ranked by engagement, all of which can be opened and viewed online. Filter by platform and view platform performance as well as what kind of content fairs better on each platform.
Use this tool to align social media chatter with ecommerce claims and pinpoint key areas of interest for your brand.
PAGE LAYOUT
While each page in the dashboard is unique, all pages are laid out in the same style of ease of use and navigation. Each page consists of a navigation panel on the left, the core visualisation in the middle and an auxiliary data panel on the right which varies depending on the theme of the page.


Powered by China Skinny’s skincare tracker, this report delves into China’s sun protection market for June 2023, covering the top 500 listings on Tmall. The report covers a market overview, top-selling claims (including which ones drive sales, and which ones drive premiums), a breakdown of the top 5 products, as well as a deep dive into the top-selling domestic and foreign products. Finally, we take a look at some case studies of what people are discussing on social media and what is trending.

Skincare Whitepaper
Our Skincare White Paper from January 2022 gives an update on the category, as well as snapshots of Tracker insight on category features, trends and consumers.
Any Questions? Get in touch.
If you have any questions or would like to get a tracker demo, then please don’t hesitate to contact us here.