
New data highlights the disparities between China’s media mix and other markets
If you needed further evidence about how different the Chinese media market is from others, look no further than Guideline SMI’s new China ad demand data. The advertising intelligence and media planning company has consolidated data from the big advertising agencies in China, providing some interesting comparisons and longitudinal tracking of spending across media platforms in the market.
A comparison with other geographies illustrates the stark differences between China and markets like the US, UK, Canada, Australia and New Zealand.

One of the biggest disparities is the small part that television advertising plays in the media mix in China. In the US, television accounts for 29.8% of ad revenue, with the UK, Canada, Australia and NZ all around the mid-late 20% mark. Whereas TV advertising in China, where all networks are controlled by the state, accounts for just 3.1% of spend.
On the other hand, digital advertising accounts for 81.9% of ad spend in China, almost double that of Australia and NZ, and around 20 percentage points higher than the US and Canada.
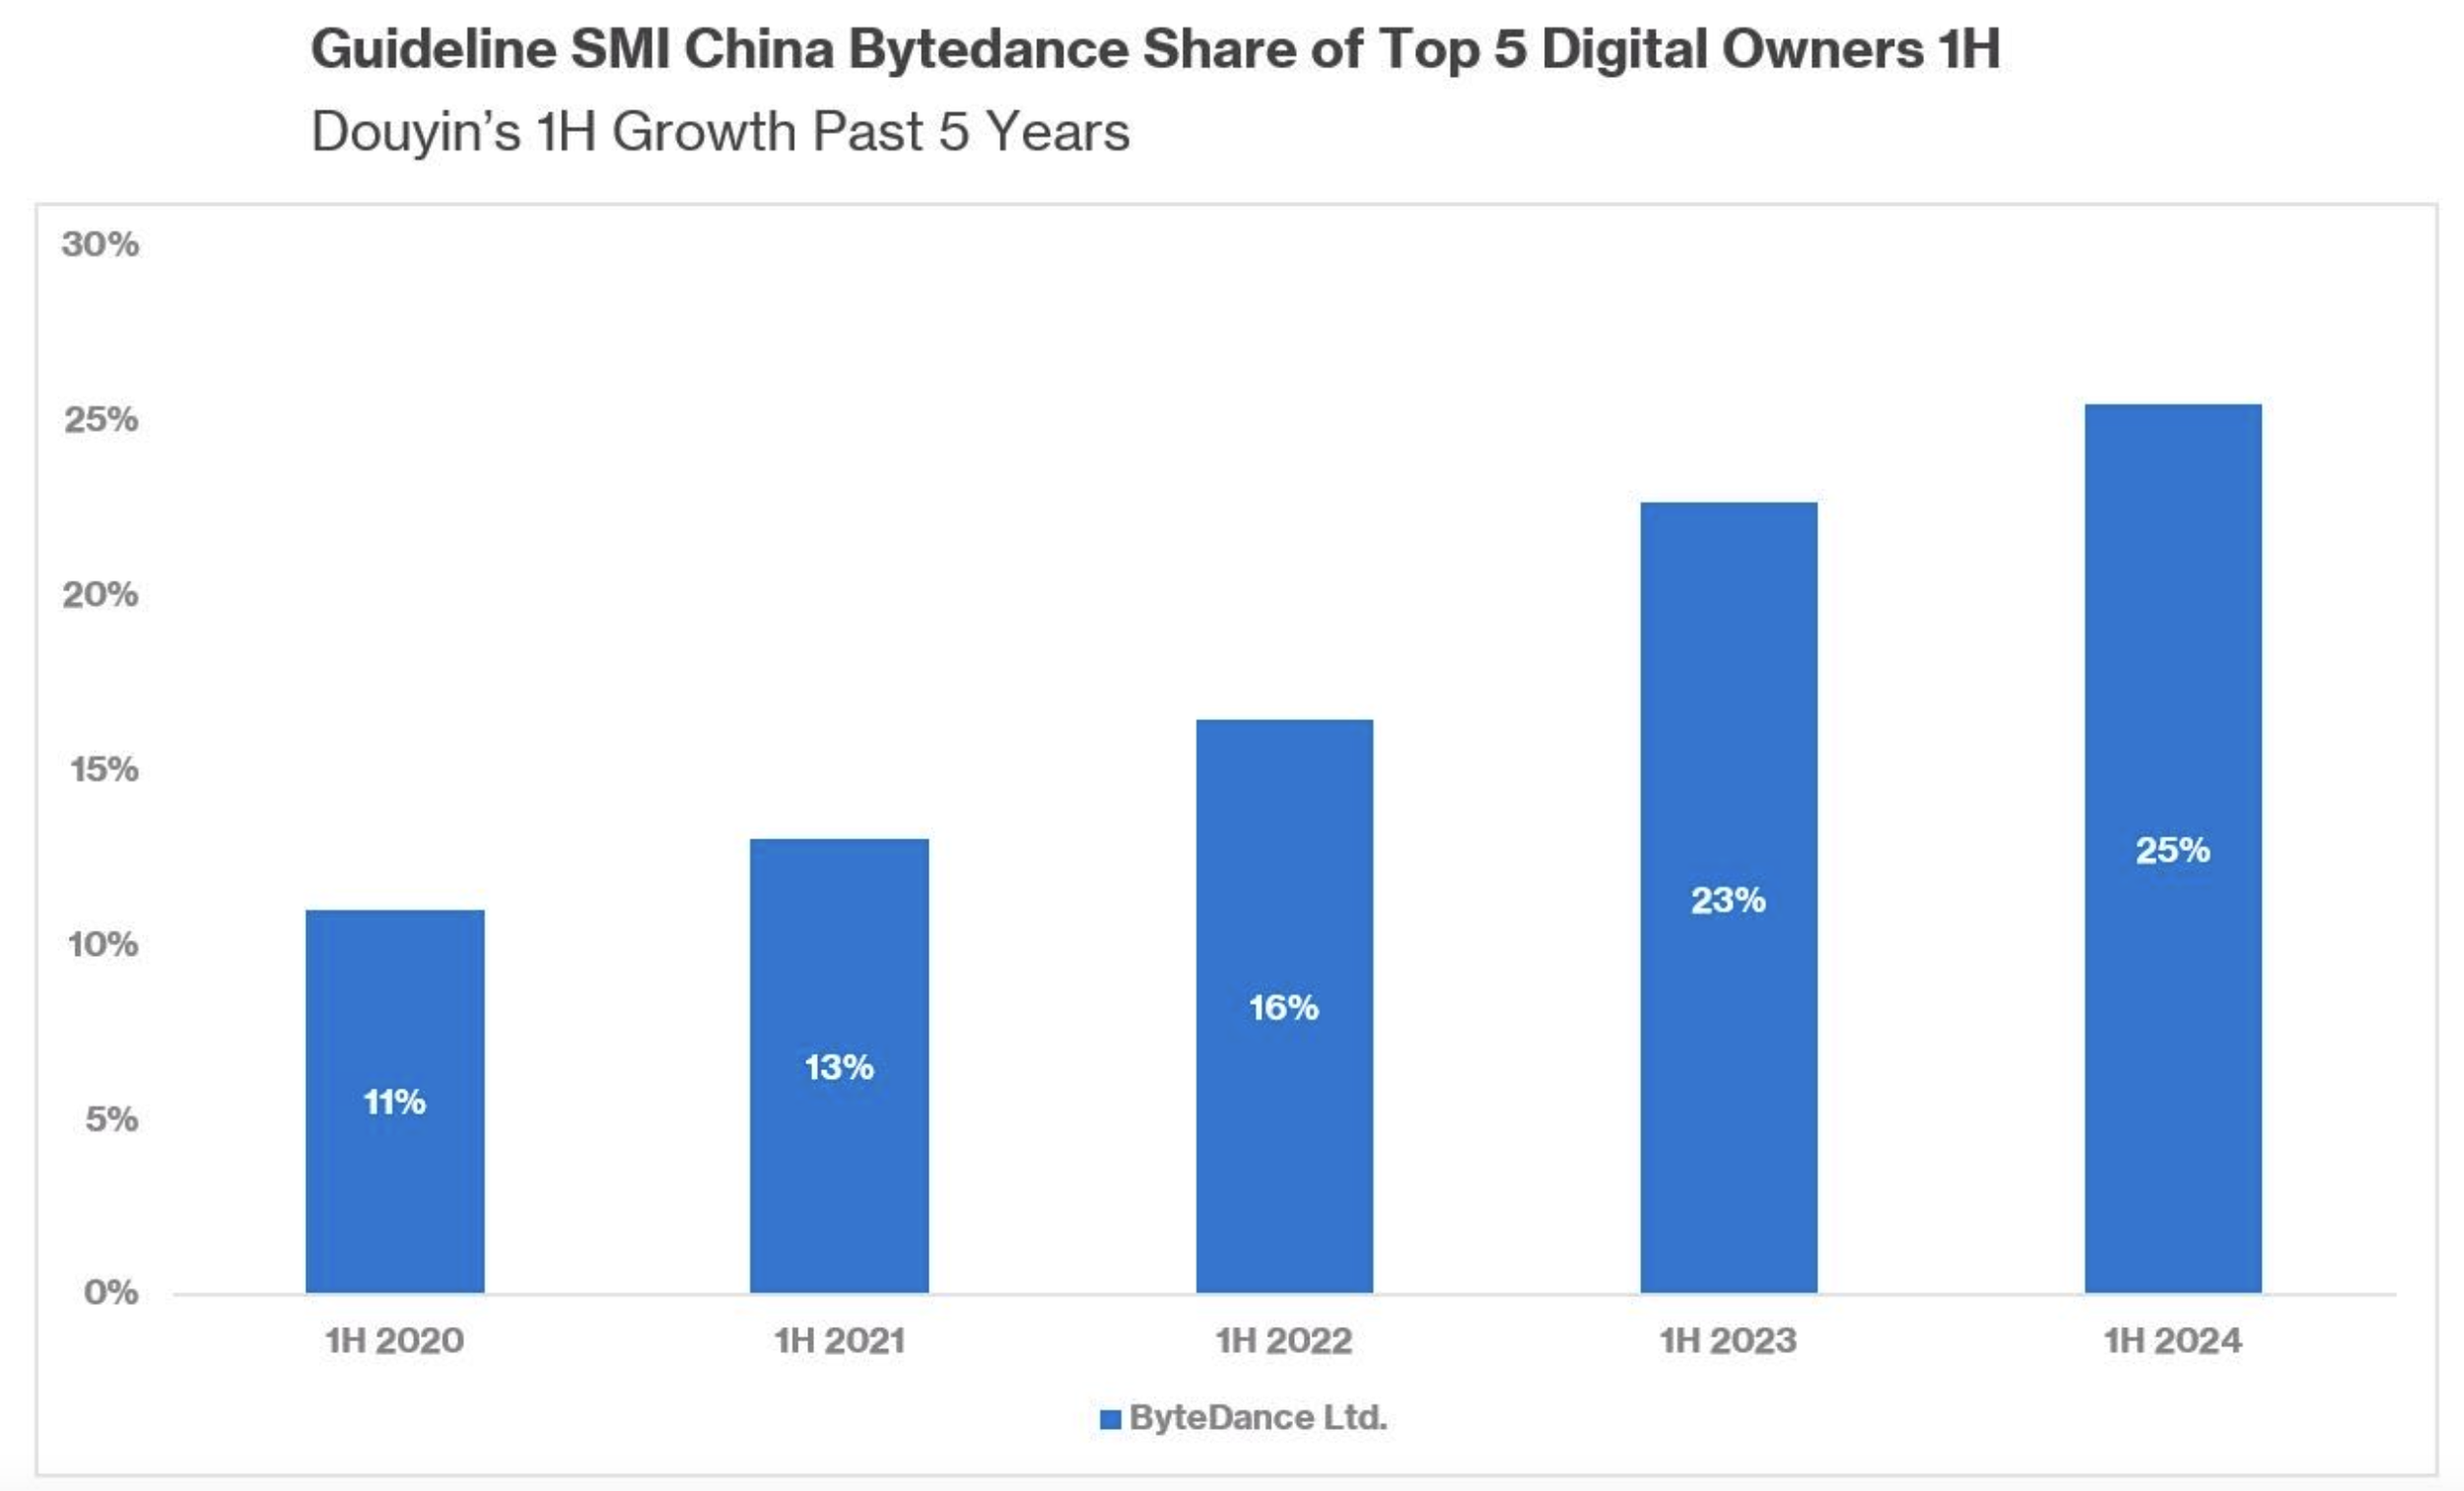
Douyin’s rise in prominence is clear, illustrated by shifts in ad spending, rising from 16% to 25% of digital ad spending in just two years.
Social Media gained the largest share of ad spend across all media sectors, at 40.5%. It continues to grow with the value of ad spend to Social Platforms 7.4% up in the first seven months of this year, while bookings to Social Video sites increased 12.7%.
Of the non-digital channels, the one to watch in China is Out of Home (OOH), which has grown from 46.3% in 2019 to dominate other mediums at 74.3% of spend this year. Many OOH ads are digital in nature and are often closely tied back to digital platforms, further reinforcing the importance of digital in the China marketing mix.

Beauty/Grooming and Clothing/Fashion Accessories are the China ad market’s largest product categories, followed by Consumer Electronics. Beauty/Grooming’s share of ad spend to Social Platforms (such as Xiaohongshu/RED, Weibo and WeChat) dipped 3.4 percentage points in the first half of this year to 29.6%.
“It is wonderful to finally have an accurate, single source, cross media view on media investment trends in China,” says Doug Pearce who leads Guideline SMI’s China operations. “Having definitive month on month, year on year changes can really help with budget setting and media planning.”
Transparent, reliable data can be hard to come by in China. At China Skinny we leave no stone unturned to find the best data sources to assist with our analysis and strategic recommendations. That is why we are chuffed that Guideline SMI is adding China to its line-up of countries to analyse. Things can all be a little less opaque in our China analysis and planning from hereon in.


There's nothing quite like staying indoors for a couple of weeks to hone in on your gaming addiction. The coronavirus outbreak and resulting time people are spending inside their homes has seen a sharp increase in Chinese playing games. At the peak of the outbreak, Chinese were spending 6.11 billion hours a day online - over seven hours for each of China's 840 million online consumers.